XKCD goes geospatial! (Happens to everything eventually...)
Fragments Nov 19
2 weeks ago
Because the shortest distance between two thoughts is a straight line
//--------------------------------------
//
// Plots a DEM generated using the MapQuest Elevation service
//
//--------------------------------------
baseLat = 46.16 ;  baseLon = -122.25;    // Mt St Helens
areaSize = 0.10;
gridSize = 100;
cellSize = areaSize / gridSize;

//---- Generate location grid
loc = select     baseLat + i * cellSize lat,
        baseLon + j * cellSize lon
    from Generate.grid(1, gridSize, 1, gridSize);

//---- Query elevation service for each grid point
telev = select lat, lon, elevJson, elev
    with {
        url = $"http://open.mapquestapi.com/elevation/v1/getElevationProfile?callback=foo&shapeFormat=raw&latLngCollection=${lat},${lon}";
        elevJson = Net.readURLnoEOL(url);
        height = RegEx.extract(elevJson, \'"height":(-?\d+)\}');
        elev = Val.toInt(height);
    }
    from loc;
Mem telev;

//---- Create raster cell boxes, symbolize with color map based on elevation, and plot
minElev = 800.0; maxElev = 2500.0;
tplot = select Geom.createBoxExtent(lon, lat, cellSize, cellSize) cell,
        Color.interpolate("00a000", "ffb000", "aaaaaa", "ffffff", index) style_fillColor
    with {
        index = (elev - minElev) / (maxElev - minElev);
    }
    from telev;

textent = select geomExtent(cell) from tplot;

Plot     extent: val(textent)
    data: tplot
    file: "dem.png";
/*=======================================================
Extracts Trips (with shapes) and stops from from a GTFS dataset.
Includes shape, trip and route information.
Spatial data is converted from Geographic to BC-ALbers

Usage Notes:
- indir: directory containing the input GTFS files
========================================================*/

indir = "";  outdir = "";

//========================================================
//  Extract Trips with unique linework, with route information
//========================================================
CSVReader tshape hasColNames: file: indir+"shapes.txt";
CSVReader ttrip hasColNames: file: indir+"trips.txt";
CSVReader troutes hasColNames: file: indir+"routes.txt";
Mem troutes;

crs_BCAlbers = "EPSG:3005";

//--- extract unique shapes
trips = select distinct route_id, trip_headsign, shape_id
    from ttrip;

//--- extract trip pts and order them in sequence
tpt = select shape_id, Val.toInt(shape_pt_sequence) seq,
		Geom.createPoint(Val.toDouble(shape_pt_lon),
                                 Val.toDouble(shape_pt_lat) ) pt
	from tshape
	order by shape_id, seq;

//--- connect pts into lines and project
tline = select shape_id,
     CRS.project(Geom.toMulti(geomConnect(pt)), crs_BCAlbers) geom
	from tpt
	group by shape_id;

//--- join route info to trip shape
trouteLines = select r.route_id, r.agency_id,
    r.route_short_name, r.route_long_name,
    r.route_type, r.route_url,
    trip_headsign, l.*
        from tline l
        join trips t on t.shape_id == l.shape_id
        join troutes r on r.route_id == t.route_id;

ShapefileWriter trouteLines file: outdir+"gtfs_trips.shp";

//========================================================
//  Extract Stop points
//========================================================
CSVReader tstopsRaw hasColNames: file: indir+"stops.txt";

tstop = select stop_id,stop_code,stop_name,stop_desc,
        CRS.project(Geom.createPoint(
	    Val.toDouble(stop_lon),
	    Val.toDouble(stop_lat) ), crs_BCAlbers) pt,
        zone_id
        from tstopsRaw;

ShapefileWriter tstop file: outdir+"gtfs_stops.shp";
Using this script on the GTFS data for Metro Vancouver (available from TransLink here) produces a dataset that looks like this:Now then, if you find yourself getting lost on the way from Foyle's to the nearest Lyon's tea shop, you can't say you haven't been warned!
- The WGS84 Cartesian axes and ellipsoid are geocentric; that is, their origin is the centre of mass of the whole Earth including oceans and atmosphere.
- The scale of the axes is that of the local Earth frame, in the sense of the relativistic theory of gravitation.
- Their orientation (that is, the directions of the axes, and hence the orientation of the ellipsoid equator and prime meridian of zero longitude) coincided with the equator and prime meridian of the Bureau Internationale de l’Heure at the moment in time 1984.0 (that is, midnight on New Year’s Eve 1983).
- Since 1984.0, the orientation of the axes and ellipsoid has changed such that the average motion of the crustal plates relative to the ellipsoid is zero. This ensures that the Z-axis of the WGS84 datum coincides with the International Reference Pole, and that the prime meridian of the ellipsoid (that is, the plane containing the Z and X Cartesian axes) coincides with the International Reference Meridian.
- The shape and size of the WGS84 biaxial ellipsoid is defined by the semi-major axis length a 6378137.0 metres, and the reciprocal of flattening 1/f 298.257223563. This ellipsoid is the same shape and size as the GRS80 ellipsoid.
- Conventional values are also adopted for the standard angular velocity of the Earth, and for the Earth gravitational constant. The first is needed for time measurement, and the second to define the scale of the system in a relativistic sense.

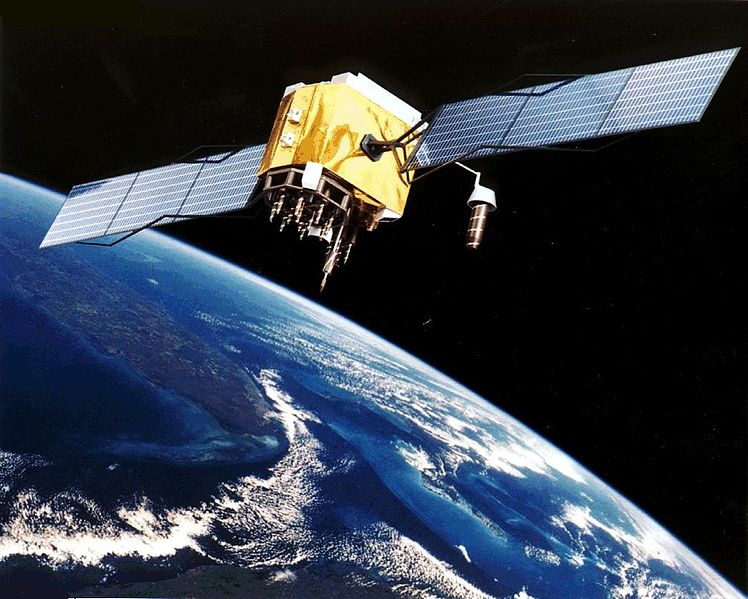
Slightly worryingly, when I was invited to watch a “contact” in another control room earlier in the day, the software crashed and a familiar, blue Microsoft Windows screen appeared on the wall
The mobile world is moving away from the chock-full-o’-content web and increasingly becoming a world of closed pipes of content, with Apple, Google, HP and Microsoft regulating the flow. Tech fiefdoms scattered across a vast open land have expanded into warring nation-states with adjacent borders. The Mac vs. PC vs. Linux argument from the early days of consumer computing has lost a great deal of its luster in recent years with the development of cloud computing on the open web, but the concept of platform wars is quickly making up for lost ground with the development of cloud computing in the closed mobile space.I've always found the Apple walled garden a bit scary in its restrictions. Now the walls are getting higher and thicker - and other vendors will be following suit as fast as they dare.


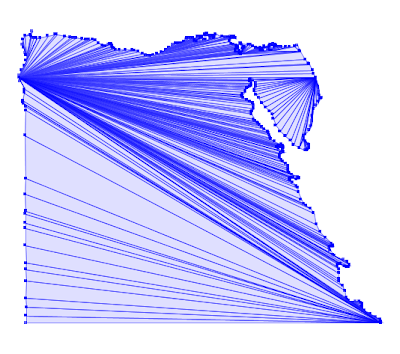
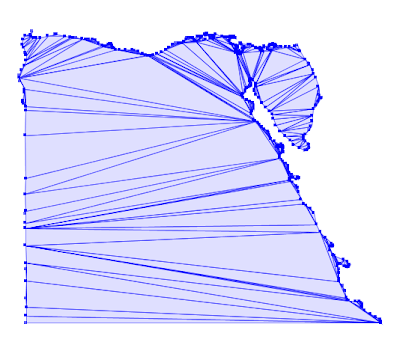
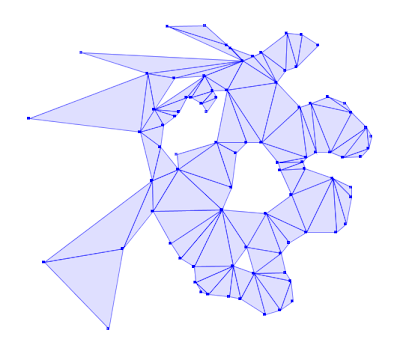 A country that has been in the news recently:
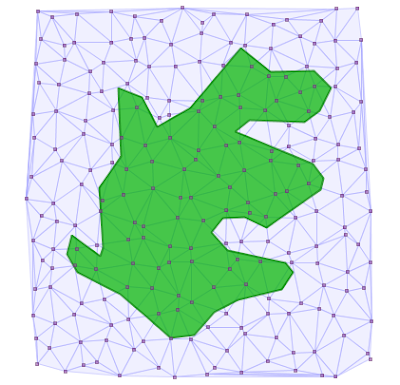
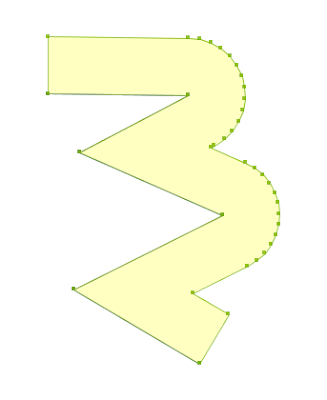
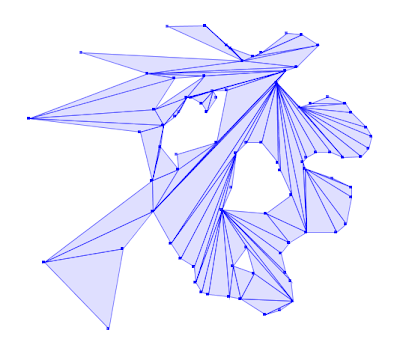
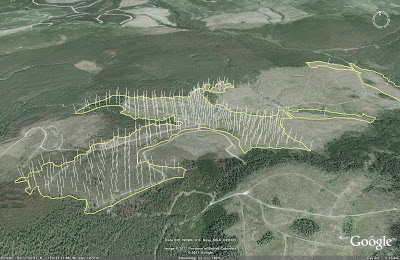
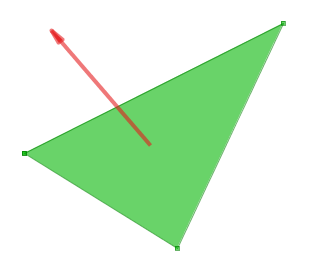 The SEA values for the triangles are averaged to compute the overall slope, aspect and elevation value for the polygon.

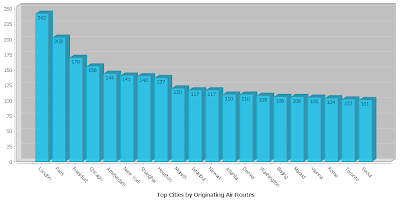
CSVReader troute hasColNames: file: "routeLine2.csv";

tCityCount = select count(*) cnt, fromCity city
 from troute
 group by fromCity
 order by cnt desc;

tdata = select city key, cnt value from tCityCount limit 20;

Chart type: "bar"
 data: tdata
 extrude:
 color: "00c0f0"
 showItemLabels:
 xAxisTitle: "Top Cities by Originating Air Routes"
 xAxisLabelRotation: -0.5
 width: 1000
 file: "cityRoutes.png";
