Sunday, 23 September 2007

Geometry Safari - Squircles, Supercircles, and Superellipses

Everyone knows that the equation of a circle is the beautifully simple:

x2 + y2 = C

An obvious generalization of this is to allow higher values for the exponent:

|x|n + |y|n = C : n >= 2

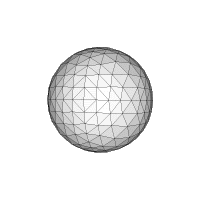
This produces a family of nicely rounded closed curves which are asymptotic to squares. For n = 4 the curve looks like this:

x4 + y4 = C

It turns out this geometric shape has been given a cute name: squircles (Who said geometry has to be dull?) The entire family is known as supercircles. And of course, there is a analogous generalization for ellipses known as superellipses. (I don't think there's a "sqellipse", however - and maybe that's just as well).

This page allows you to generate supercircles for different values of n. (Incidentally it uses Walter Zorn's very slick jsGraphics library for generating pixel & vector graphics on web pages).

Useful? Sort of - Wikipedia has a few examples, mostly in the decorative arts. And I'm betting that a concept this elegant is bound to turn up in lots more places. So maybe I should add this to JTS, just to - ahem - get ahead of the curve.

Friday, 21 September 2007

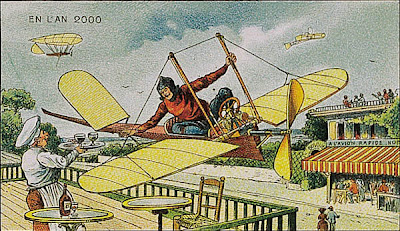
En l'an 2000

The Bibliotheque Nationale de France has an online exhibition of a vision of the world in the year 2000 - published in the year 1910. It's interesting to see what the artist got right, and what he got wrong. Air-Sea Rescue - but also radium fireplaces. He correctly predicted that electric power would replace human labour - but he didn't foresee that the biggest impact would be from automating thought rather than muscle.

He also didn't see that the fashions of 1910 would not be a la mode in 2000. But it's an appealing vision... I'm still hoping for my personal monoplane to get me to work.


Monday, 17 September 2007

Bursa-Wolf transformations explained

.. courtesy of Adrian Custer on the OpenJUMP mailing list:

> > just one question .. what is this bursa wolf parameter option?

> My impression is that this is scary math I never quite understood.


Well, Bursa was a 9 year old bicyclist from the Alps and...no, no, no, i
lie. Actually it's not particularly scary math and quite easy to
understand. All you really need to remember is that no one has ever been
to the center of the earth.


So everyone started surveying (mostly so the repressive central
governments could exploit taxes from people and have lots of jolly wars
where people could slog through the mud and kill each other so they'd be
blood and suffering for all). Each group started from some random place
on the surface of the earth. Right away, it becomes obvious to everyone
that euclidean rules don't work so well. Some didn't care so much since
taxes are basically arbitrary anyway and getting serious about it means
you'd have to walk through fields and woods and get lots of mud on your
shoes. Others kept at it and resorted to spherical geometry. Once you
start doing that precisely and at continental scales you realize that
doesn't really work either so you decide to try the next hardest thing,
an ellipsoid of rotation. Now how do you know which one to choose? Well
you pick one that minimizes your squared errors. All good and nice but
(1) you are surveying the ground which is anything but an ellipsoid
since it has all those ditches you keep falling into and that keep
getting your clothes covered in mud and (2) you are not perfect
especially with all that mud on your paper. So you have a bunch of
errors. Well everyone that does this comes up with lots of different
ellipsoids that work really nice for their data and everyone is sure
they clearly have found the 'one true ellipsoid' and they decide to use
that for all their work. Then everyone guesses where they actually are
on each of their particular ellipsoids which involves lots of going
outside at night and looking up from the mud at the stars. But then it's
not like the edges of each survey was nice and level on these ellipsoids
either --- think of the eastern USA. You can start nice and clean and
warm and dry at an inn in Boston on the edge of the sea drinking clam
chowder and having a good time but a few months later it will be bitter,
bitter cold in that tiny town of Denver because you are somewhere like a
mile high up in the air and you're wet and covered in mud from slogging
through the plains in a snowstorm. So you've got a pretty good idea that
your data is on a major slant but, well, you'll do your best to make up
for it but it really doesn't help the effort any, especially what with
all that mud that's still itching in your hair. So your errors may be a
wee bit big but hey it's all right: it's good enough to wage lots of
good wars with lots of mud and blood and to keep collecting lots of
taxes so no one cares too much.


Fast forward to more recent times where some people want to talk to lots
of different governments and work with lots of different data. They take
everyone's guess and try to line them up. Well it turns out, when you
try to line everything up, that the center points of all the different
ellipses aren't really the same points and even the orientation of the
three axes are all a bit off because of how everyone guessed where their
were on their ellipsoids. So now, to go from one data set to another so
they line up "the best," you need estimates of how much to rotate each
of the axes and how to shift the center point around; all this beyond
even the obvious stuff of changing between the different definition of
all those "one true" ellipsoids.


When you do this mathematically, you need a bunch of parameters: these
now have the names of the wolf and the bursa. Generally, you can only
come up with good parameters if you have lots of data to compare and
some good software to do the comparing. That's what the EPSG did for
everyone. The guys in the pickup trucks that went out looking for oil
kept falling into ditches along the way and getting mud on their faces
but when they got back to the office they had a good sense of what lined
up with what and could say: "yep, that hill there is the same as this
squiggle here and there's this big ditch right here that cost us our
third flat tire and..." So they collected as much data as they could and
compared it and came up with a database of parameters by which you go
from one data set to another. So that's it. That's why we use their
data; we don't have to fall in any ditches and can avoid getting mud on
our clothes. They give us their parameters and we can mostly line up
data from one survey against data from another. But you do need some
good parameters because the earlier folk had a harder time of the mud
and the data they created don't just line up the way we would like them
to.


Actually doing the math is a bit harder but the concept is pretty
straight forward: geographic data all ultimately gets tied into points
on the earth surface and that requires estimating where the points
really are and how they line up on the estimated ellipsoid being used.
That in turn means none of ellipsoids quite line up and we need
parameters to move between them.


--adrian

Friday, 14 September 2007

Office 2.0

Office 2.0 is an index of Web-hosted applications. The entire list is pretty overwhelming, but more immediately interesting is the list of Web apps that the site's creator uses as his "everyday applications"

Maybe there's something to this Web thing after all...

Late notice: Waterfall 2006 conference on Project Management

Here's an important conference which unfortunately I missed last year. But no matter - the content is timeless, so no doubt it will be held over and over again with exactly the same presentations.

Thursday, 13 September 2007

Quote of the day - C. A. R. Hoare

There are two ways of constructing a software design: One way is to make it so simple that there are obviously no deficiencies, and the other way is to make it so complicated that there are no obvious deficiencies. The first method is far more difficult.

- C. A. R. Hoare

Geodetic data in PostGIS - Spherical indexing schemes

Here at Refractions we're starting to think about how we can provide better support in PostGIS for geodetic data. Geodetic data is data which is defined in a true spherical coordinate system (in particular, of course, the surface of the Earth).

Currently PostGIS provides some geodetic-aware functions (such as distance between two geodetic points). But it's current spatial data model is fundamentally planar, so there are definite limitations to modelling geodetic data (e.g. such as the notorious "line crossing the Date Line" problem). As PostGIS gets used for larger datasets and more ambitious projects, the utility of having a full-function geodetic data model is becoming increasingly obvious.

Handling geodetic data in a correct and efficient way presents quite a few challenges. A major one is: how can geodetic geometry be spatially indexed? Conventional spatial indexes (such as 2D R-trees) all rely on geometry being embedded in a planar space. They don't handle data which can "wrap around", as can occur in a spherical space.

There have been various clever proposals for spherical indexing strategies. Some prominent ones are listed below:
  • Hierarchical Triangular Mesh - this is essentially a "quad-tree for the sphere". It has a lot of appeal for use with point data, since it provides a hierarchical key which can be indexed using a conventional B-tree index. (It was co-developed by the late, great Jim Gray in order to index astronomical data). The mathematics to determine the index key for a non-point object would seem to be somewhat complicated. It also seems like HTM would suffer from the usual disadvantage of quadtrees of not being very self-tuning. Another disadvantage from the PostGIS point of view is that this would likely be a brand new index type (i.e. lots of difficult code to write)
  • Hipparchus Voronoi-based index. This index can be thought of as a fixed-grid index using a custom Voronoi cell coverage for the globe. IBM's DB/2 Geodetic extension uses this scheme. I must say that this concept, while ingenious, seems a bit baroque to me. This index has the usual disadvantage of fixed-grid indexes of not handling widely-varying data sizes well. And it also requires extremely complex cell coverage structures, which have to be selected specifically for the expected data composition. DB/2 supplies 13 different ones based on various data densities (G7 industrial output, anyone?). I'm not sure what you are supposed to do if your data has some other density distribution - it doesn't seem very feasible to make your own Voronoi grid. And what if you don't know your data distribution, or it changes over time?

  • 3D Bounding Box - this is the approach used by the pgSphere project. It's pretty straightforward. The key concept is to embed the sphere in 3-space, so that it is possible to compute 3D bounding boxes for geometries on the embedded sphere. The bounding boxes can then be indexed using a 3D R-tree (exactly analogous to a 2D R-tree spatial index). The GIST index supplied with PostgreSQL can be customized to provide the required 3D R-tree. One possible issue is that apparently R-trees become "less effective" in higher-dimensional spaces. It remains to be seen whether this is truly a serious problem.
Out of these options, it seems like the 3D Bounding Box approach is the most straightforward scheme. There's some challenges in developing the mathematics required (at least, for a planar/linear guy like me), but I'm hopeful that we can deal with these issues and arrive at a efficient, maintainable solution.

Thursday, 6 September 2007

If REST and WS-* are at war, which one are they fighting?

Ted Nedward has another great post providing lessons about technical, political and historical issues all at the same time.

Let's just hope it isn't the Hundred Years War instead...

Tuesday, 4 September 2007

Grokking hierarchical queries in Oracle

Oracle provides a very powerful SQL extension to evaluate hierarchical queries (transitive closures) on tables. This recently saved my bacon in a system which processed a table modelling a tree containing several hundred thousand rows. The alternative would have been to do some very ugly and inefficient iterative querying.

There's a few tutorials about Oracle hierarchical queries on the Web, but I didn't find any of them gave me a good mental model of how these queries are evaluated. In particular, they didn't really help me in figuring out how to traverse a tree structure either upwards or downwards. So here's my attempt at explaining some patterns for using hierarchical queries. (This isn't a complete tutorial - for that check the Oracle 10g documentation)

For modelling tree-structured data, the usual pattern is to have a table with id and parent_id columns. In a hierarchical query you may wish to traverse the tree either upwards (towards the root(s)) or downwards (towards the leaves). But what query syntax should be used to produce the desire direction?

The general syntax for CONNECT BY is:

CONNECT BY [PRIOR] col1 = [PRIOR] col2

A further constraint is that the PRIOR keyword can appear once only, but it can appear on either side of the equality condition. Since the equality condition is symmetric, there are really only two possibilities:
  1. CONNECT BY PRIOR parent_id = id (which is equivalent to CONNECT BY id = PRIOR parent_id)
  2. CONNECT BY PRIOR id = parent_id (which is equivalent to CONNECT BY parent_id = PRIOR id)
Oracle evaluates the hierarchical query in the following way:

1. The result rowset is initialized with the rows determined by the START WITH clause
2. All rows for which the CONNECT_BY condition is true are added to the result rowset. The PRIOR keyword determines which one of the condition expressions is evaluated in the context of the result rowset rows.
3. Step 2 is repeated until no further rows match.

Formally, this procedure computes the transitive closure of the relation defined by the initial START WITH set and the CONNECT BY condition.

Given this evaluation rule, we obtain the following rule-of-thumb for writing a query to traverse in a desired direction:
  • To traverse upwards, use form #1
  • To traverse downwards, use form #2
There's several other useful parameters for defining hierarchical queries in Oracle, such as NOCYCLE, LEVEL, CONNECT_BY_ROOT, CONNECT_BY_ISLEAF, etc. It's well worth studying how to use these to improve query power and performance.

Monday, 3 September 2007

Natural Docs for code documentation generation

Natural Docs looks like a nice generator for code documentation. It's multi-language, with a more natural commenting style than Javadoc. It seems to be in fairly steady development, and has a slick homepage.

A quick browse of Wikepedia reveals a zillion documentation generators. This isn't really a surprise - once again the OSS ecosystem thoroughly fills a technological niche! Robodoc and Doxygen are other leading players. Wikipedia is (rightly) very neutral in its comparison. I'd be interested to learn if there is a reason to prefer one more than the others (say, from the point of view of wanting to support a new language).