Hans Lundmark has an interesting page on
visualizing complex functions. The idea is to map functions from
f :
C →
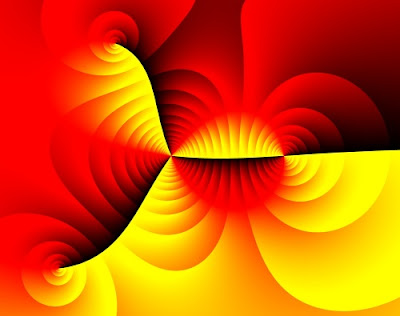
C using position, hue, and saturation. The domain values of the function provide the (x, y) position. The function output value provides the hue and saturation; the hue is determined by the complex argument (angle), and the saturation is determined by the absolute value.
The output struck me as a nice example of
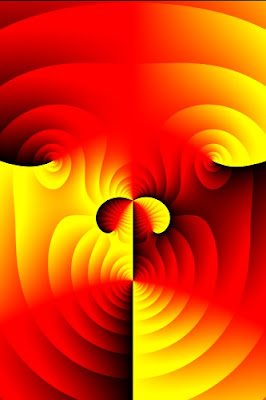
algorithmic art. I whipped up my own version in Java to experiment, and to be able to produce high-resolution images for printing. Here's a couple of my images:
An example function from the paper (
f (
z ) = (
z − 2 )
2 (
z + 1 − 2
i ) (
z + 2 + 2
i ) /
z3 )
 "Wild Walrus"


2 comments:
Impressive!
Also, check out this oscilloscope demo, done by a 15-year-old. Amazing stuff.
Post a Comment