Friday, 9 March 2012

The TI-58/59 programmable calculators

Mobile computing is nothing new!  My first programmable device was a TI-58 calculator:


I spend many happy hours punching in the code for Lunar Lander (and less time actually playing it).  Wish I still had my coding sheets for the various apps I dreamed up.  (For some reason, the convention then was to write the key codes vertically, rather than horizontally.)

TI had their own app store, selling Solid State SoftwareTM on plug-in ROM modules.  Of course I got the Leisure one, which had a few lame games on it.  Then as now, though, I had a lot more fun coding up new apps than playing games...

The calculator cognoscenti will notice the image is actually the TI-59, with the built-in magnetic card reader for offline permanent storage.  Had one of those too, once I got tired of eternally punching in programs. The mag card reader was pretty finicky, but it sure was cool filling up that little vinyl case with all that software that never got used...

A couple of years later HP released the iPhone of the calculator era - the HP-41C, which had an alphanumeric display!  HP was just as opinionated as Apple, in their own way - if you wanted one of their gorgeous units, you had to grok RPN notation. Kinda reminds me of my current effort of learning git.  I never did get one of those units, because by that time it was a lot more rewarding to punch code into a real microcomputer....

Reminiscing about the PC Pre-Cambrian explosion


With the mobile meteorite looming ever larger over the landscape of Planet PC, it seems like a good time to recall some memories of the last major transition in the computer world. I call this the Pre-Cambrian explosion of Personal Computers.  It took place from the mid-70's to the early 80's, when dozens of entrepreneurial companies sprang up all hoping to hit the magic combination of hardware and software and sell a zillion units.

In a way, it was exactly the inverse of what is happening now. Back then, a myriad of bizarre life forms sprang up to fill the niche exposed by the advent of the microprocessor, only to be driven into extinction by the arrival of a behemoth with superior reproductive capability.


Whereas today, the new ecological zone was initially colonized by a single fierce predator, who may yet out-compete all other arrivals trying to crawl out onto the shore of the new territory.


On to a series of occasional posts on the Pre-Cambrian PC era...

Thursday, 8 March 2012

Java's vision for the future

Just noticed this slideshow from QCon 2012 on the vision for Java's evolution over the next few versions.

Some highlights of JDK 8:
  • closures via lambda expressions
  • filter-map-reduce framework
  • modules
and further out:
  • JNI goes away!
  • support for big in-memory data (arrays) and data structure optimizations
A key driver of these enhancements is the transition to multi-core and the end of the free performance lunch.  This is a great graph that puts it in perspective - those flat lines are the lunch bill arriving.


QCon always has excellent presentations, so I'm sure there's some other thought-provoking slideware on that site as well.


Tuesday, 6 March 2012

Battle of the Spatial Scripting Languages!

The gloves are down in this exchange on gis.stackexchange, over LOC counts for Fiona, JEQL, and GeoScript-JS.


Fiona takes one on the chin in the first round!  But Sean recovers quickly, and makes a hit by pointing out that Fiona allows defining new functions right in the scripting language.  This would be feasible in JEQL as well, by providing hooks to into JVM-based scripting languages.  And it's also very easy to develop extensions as simple Java functions or classes.

Now, this is really just a schoolyard scuffle over a very simple use case for spatial scripting.  What the fans really want to see is a face-off over a more complex task...

Wednesday, 22 February 2012

A cool application of JTS Voronoi diagrams

I just noticed this series of posts by Stephen Mather on generating medial axes of polygons by creating Voronoi diagrams on the densified linework. 


If I read correctly, he's doing this via Python GeoScript, which uses JTS for the heavy lifting.

As he says, this is a venerable technique ( hack) for creating medial axis approximations.  Regardless of its computational soundness (and hey, whatever works), it's a great example of using a series of complex geometric operations to compute a useful result.

I'll have to try this in JEQL....

(Stephen seems to have moved on to implementing the Scale Axis Transform in PGSQL - very impressive!)

Tuesday, 21 February 2012

Barnes Analysis for Surface interpolation

Recently I've been working on generating surfaces from irregular sets of data observations, for thematic rendering purposes.  The data I'm working with is meteorological measurements (e..g max and min temperature, average rainfall, etc.).  Here's a sample:
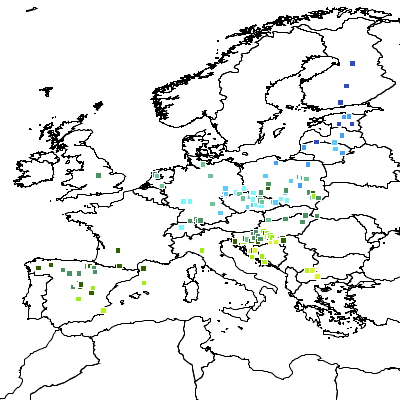
Maximum Daily Temperatures for November 30, 2010

There are many, many different ways of interpolating surfaces - Wikipedia has a long list.  It turns out that a classic approach for interpolation of meteorological data is Barnes Interpolation (also called Barnes Analysis).  Barnes Interpolation is a surface estimating technique which uses an initial pass to provide a smoothed estimate of the surface, and optionally further refinement passes to improve the surface to more closely match the observation values.  The initial pass produces an averaged (smoothed) surface, using a summation of exponential (Gaussian) decay functions around each observation point.  Subsequent refinement passes compute an error surface using the delta between the previous estimated surface and the observations.  The error surface is added to the previous estimate surface to refine the estimate (by reducing the delta to the observations).

I'm more of a vector guy than a raster guy, but I figured that Google and Wikipedia would make short work of this - after all, how hard can raster be?  Unfortunately, the Wikipedia article is not very helpful - the description is unclear, and it doesn't even define all the symbols used in the presented equations.  I found some better references here and here, but they still contained some confusing discrepancies in the equations.  Barnes' original paper is online as well, but as is often the case with primary sources, it is more concerned with the physical properties of the analysis, and doesn't have a very crisp description of the actual algorithm.

Triangulating between the various sources, I eventually arrived at the following algorithm definition (provided herewith without warranty!):

Barnes Interpolation Algorithm

For the first pass, the estimated value Eg at each grid point gx,y is:

   Eg = ( wi * oi) / ( wi )

where:
  • oi is the value of the i'th observation point
  • wi is the weight (decay function) value for the i'th observation point, defined as
      wi = exp(- di2   /   L2C  )

where:
  • di is the distance from the grid point to the i'th observation point
  • L is the length scale, which is determined by the observation spacing and the natural scale of the phenomena being measured.  
  • C is the convergence factor, which controls how much refinement takes place during each refinement step.  In the first pass the convergence factor is 1. For subsequent passes a value in the range 0.2 - 0.3 is effective.
During refinement passes the estimate at each grid point is re-computed using:

  E'g = Eg + ( wi * (oi - Ei) ) / ( wi )

where:
  • Ei is the estimated value at the grid cell containing the i'th observation point

The target development platform is Java (of course).  For prototyping purposes I used JEQL to read sample datasets, run the algorithm with various parameter choices, and produce plots to visualize the results.  Here's the surface plot for the dataset above:


This looks pretty reasonable, and provides a nice visualization of the large-scale data trend. (Surprise!  It's hotter down south...)  The ultimate goal is much more exciting.  The algorithm will be provided as a Rendering Transformation in GeoServer, allowing surfaces to be generated dynamically from any supported datastore.  This will open the way to providing all kinds of further surface visualizations, including other interpolation techniques - as well as everyone's favourite, Heat Maps (aka Multivariate Kernel Density Estimation).

Now, the pure mathematical description of the algorithm is sufficient for a proof-of-concept implementation producing single images.  But to make it usable in a dynamic way in a high-demand environment, there are more details which need to be worked out to improve performance and functionality.  For instance:
  • How large an extent of data points is necessary to produce a stable surface for a given area?  This is important for dynamic presentation, since zooming, panning and tiling should not change the appearance of the surface.  Of course, all data points could always be used, but more selectivity improves performance.
  • How far should the surface be extrapolated into areas of few or no data observations?  Apart from the validity implications, limiting the extent of the computed surface provides a boost in performance. 
  • A further performance increase may be gained by computing the surface on a coarse grid, then up-sampling in an appropriate way to the display resolution.
  • For data which is global in scope, how does the algorithm need to be changed to accommodate computation on the spheroid?  It seems likely that it's necessary to use a geodetic distance calculation, and there may be other impacts as well.

Friday, 27 January 2012

Let's do it again at FOSS4G-NA!

FOSS4G 2011 in Denver last September was such a good time, we're going to do it all over again at FOSS4G North America 2012


It will be interesting to see who and how many attend.  Some conference budgets might have been blown last year - but note that this event is cleverly timed to fall into a new fiscal!  And being in D.C. there should be lots of suits and spooks in attendance.

I'm definitely looking forward to building on the momentum from the last conference, especially given my new gig with OpenGeo (ok, I'm definitely not booth-babe material - but being a booth-geek is probably more fun). 

Thursday, 17 November 2011

Your Favourite Map Projection

...and what it says about you.


XKCD goes geospatial!  (Happens to everything eventually...)


Thursday, 10 November 2011

OpenGeo Interview

My name in lights once again.  If this keeps up I'm going to have to start asking for an outrageous rider...


Thursday, 27 October 2011

Sobering thought

According to this interesting BBC page on population, the number of humans on Earth has more than doubled in my lifetime.


Anyone who has spent time trying to speed up an O(n^2) algorithm knows this can't be a good thing...

Tuesday, 25 October 2011

Using a web service for Elevation from JEQL

MapQuest has a whole range of useful and freely available web services for geospatial queries.  One of these is the Open Elevation Service.  I thought it would be interesting to try it out using JEQL's capabilities of querying URLs and plotting datasets as images.

The Open Elevation Service is extremely simple to use.  You just submit a URL containing the location:

http://open.mapquestapi.com/elevation/v1/getElevationProfile?callback=foo&shapeFormat=raw&latLngCollection=39.740112,-104.984856

and you get back a JSON (or XML) response with the elevation:

 foo({
"shapePoints":[39.740112,-104.984856],
"elevationProfile":[{"distance":0,"height":1616}],
"info":{"copyright":{"text":"© 2011 MapQuest, Inc.","imageUrl":"http://tile21.mqcdn.com/res/mqlogo.gif","imageAltText":"© 2011 MapQuest, Inc."},
"statuscode":0,
"messages":[]}
});

JEQL doesn't (yet) do JSON parsing, but it's easy to pick out the height attribute with a simple RegEx:

height = RegEx.extract(elevJson, \'"height":(-?\d+)\}');

Querying over a grid of locations provides a dataset which is a gridded Digital Elevation Model (DEM).  JEQL provides a function to generate a table which is a grid of integers, so it's easy to produce a grid of lat/long locations:

loc = select baseLat + i * cellSize lat, baseLon + j * cellSize lon
    from Generate.grid(1, gridSize, 1, gridSize);


Once the elevations for all locations are retrieved,  the locations are used to compute square cells (polygons) which cover the area, and the cells are symbolized with a fill value from a suitable color map based on elevation.

Here's the final result.  It's slightly squashed in aspect ratio, since the data grid is in the lat/long coordinate system.  The obvious data dropouts seem to be hard errors in the MapQuest service, which is slightly surprising.  But's it's recognizably Mt. St. Helens - you can even see the lava dome in the crater!


Not surprisingly, this isn't quick to generate - the service runs at about 10 queries per second.  (Actually, that seems pretty reasonable for a free web service!).  The service does support querying multiple points per request - I might try to see if this decreases the latency (although this might be a bit complex to express in JEQL).

Here's the whole script:

//--------------------------------------
//
// Plots a DEM generated using the MapQuest Elevation service
//
//--------------------------------------
baseLat = 46.16 ;  baseLon = -122.25;    // Mt St Helens
areaSize = 0.10;
gridSize = 100;
cellSize = areaSize / gridSize;

//---- Generate location grid
loc = select     baseLat + i * cellSize lat,
        baseLon + j * cellSize lon
    from Generate.grid(1, gridSize, 1, gridSize);

//---- Query elevation service for each grid point
telev = select lat, lon, elevJson, elev
    with {
        url = $"http://open.mapquestapi.com/elevation/v1/getElevationProfile?callback=foo&shapeFormat=raw&latLngCollection=${lat},${lon}";
        elevJson = Net.readURLnoEOL(url);
        height = RegEx.extract(elevJson, \'"height":(-?\d+)\}');
        elev = Val.toInt(height);
    }
    from loc;
Mem telev;

//---- Create raster cell boxes, symbolize with color map based on elevation, and plot
minElev = 800.0; maxElev = 2500.0;
tplot = select Geom.createBoxExtent(lon, lat, cellSize, cellSize) cell,
        Color.interpolate("00a000", "ffb000", "aaaaaa", "ffffff", index) style_fillColor
    with {
        index = (elev - minElev) / (maxElev - minElev);
    }
    from telev;

textent = select geomExtent(cell) from tplot;

Plot     extent: val(textent)
    data: tplot
    file: "dem.png";

Monday, 24 October 2011

(r-i-p (john mccarthy))

John McCarthy, inventor of LISP, has died at age 84. 

Having finally balanced his parentheses, his atoms can now be returned to the free list.

Jobs, Ritchie, McCarthy - so many of the greats passing....


Friday, 7 October 2011

Extracting GTFS data using JEQL

Once you understand the General Transit Feed Specification (GTFS) data model, the next step is to transform the data into a format usable in GIS tools.  As usual, that means shapefiles (sigh...).  Here's a JEQL script that extracts the geometry of all unique trips (aka "route patterns"), as well as the stop locations.

Some interesting aspects of the script:
  • the GTFS spatial data is in geographic coordinates (lat/long). The script projects this into BC-Albers (EPGS code 3005) using the CRS.project() function.  Many other coordinate systems could be used (or none - e.g. for output to KML)
  • the geomConnect()aggregate function connects Points into LineStrings


/*=======================================================
Extracts Trips (with shapes) and stops from from a GTFS dataset. 
Includes shape, trip and route information.
Spatial data is converted from Geographic to BC-ALbers

Usage Notes:
- indir: directory containing the input GTFS files
========================================================*/

indir = "";  outdir = "";

//========================================================
//  Extract Trips with unique linework, with route information
//========================================================
CSVReader tshape hasColNames: file: indir+"shapes.txt";
CSVReader ttrip hasColNames: file: indir+"trips.txt";
CSVReader troutes hasColNames: file: indir+"routes.txt";  
Mem troutes;

crs_BCAlbers = "EPSG:3005";

//--- extract unique shapes
trips = select distinct route_id, trip_headsign, shape_id 
    from ttrip;

//--- extract trip pts and order them in sequence
tpt = select shape_id, Val.toInt(shape_pt_sequence) seq,
		Geom.createPoint(Val.toDouble(shape_pt_lon), 
                                 Val.toDouble(shape_pt_lat) ) pt
	from tshape
	order by shape_id, seq;

//--- connect pts into lines and project
tline = select shape_id, 
     CRS.project(Geom.toMulti(geomConnect(pt)), crs_BCAlbers) geom
	from tpt
	group by shape_id;
	
//--- join route info to trip shape
trouteLines = select r.route_id, r.agency_id, 
    r.route_short_name, r.route_long_name,
    r.route_type, r.route_url,
    trip_headsign, l.*
        from tline l
        join trips t on t.shape_id == l.shape_id
        join troutes r on r.route_id == t.route_id;

ShapefileWriter trouteLines file: outdir+"gtfs_trips.shp";

//========================================================
//  Extract Stop points
//========================================================
CSVReader tstopsRaw hasColNames: file: indir+"stops.txt";

tstop = select stop_id,stop_code,stop_name,stop_desc,
        CRS.project(Geom.createPoint(
	    Val.toDouble(stop_lon), 
	    Val.toDouble(stop_lat) ), crs_BCAlbers) pt,
        zone_id
        from tstopsRaw;

ShapefileWriter tstop file: outdir+"gtfs_stops.shp";

Using this script on the GTFS data for Metro Vancouver (available from TransLink here) produces a dataset that looks like this:


JTS & GEOS Wordles

For my JTS talk at FOSS4G I created a couple of Wordles showing systems which use JTS and GEOS.  Here they are for posterity (and because I love seeing Wordles...)


Thursday, 29 September 2011

Lars Rasmussen on the startup of Google Maps

Here's some interesting background to where Google Maps came from.  Must feel pretty good to have created a revolution (slippy maps) - and maybe to have just missed creating another one (Google Wave as an alternative to email).


Tuesday, 27 September 2011

Data model diagrams for GTFS

Recently I've been doing some work with the General Transit Feed Specification (GTFS).  This is a simple data model initiated by Google, in order to allow transit organizations to publish their schedules for routing and visualization purposes.

As usual, Google has nice, succinct documentation for the GTFS format (which is a set of CSV files embodying an implicit data model).  But I was surprised to find that they don't provide any kind of data model diagram showing the relationships between the various entities (files) in the model.  I have a feeling that they think this would be "too technical" for users - or maybe they just don't believe in using a long-established body of theory?

So, to help my understanding of GTFS I put together a simple diagram of the data model.  I used Google Diagrams, which is why this looks a little primitive.   (Hmmm... maybe another reason they don't do diagrams is that they are religious about dog-fooding?)


After doing this I found the paper A Transmodel based XML schema for the Google Transit Feed Specification, which has a much more detailed UML model of GTFS:


The end goal of doing all this was to be able to transform a GTFS data feed into shapefile format.  For this I used a simple JEQL script.  But that's another blog post.

Monday, 19 September 2011

Paul Ramsey's Keynote at FOSS4G 2011

As usual, Paul delivered a highly amusing and thought-provoking keynote at FOSS4G 2011.  For the benefit of the hard-core twitterless, the slides are here.


Thursday, 1 September 2011

Everything you wanted to know about UK Coordinate Systems

Those helpful folks at the UK Ordnance Survey have provided a fine reference Guide to Coordinate Systems in Great Britain.  It's well worth reading if you're interested in the intricacies of coordinate systems, datums, surveying and GPS.  It's a bit technical, but if you can handle coding in Javascript you can probably get something out of it...

An interesting extract gives the general flavour:
  • The WGS84 Cartesian axes and ellipsoid are geocentric; that is, their origin is the centre of mass of the whole Earth including oceans and atmosphere.
  • The scale of the axes is that of the local Earth frame, in the sense of the relativistic theory of gravitation.
  • Their orientation (that is, the directions of the axes, and hence the orientation of the ellipsoid equator and prime meridian of zero longitude) coincided with the equator and prime meridian of the Bureau Internationale de l’Heure at the moment in time 1984.0 (that is, midnight on New Year’s Eve 1983).
  • Since 1984.0, the orientation of the axes and ellipsoid has changed such that the average motion of the crustal plates relative to the ellipsoid is zero. This ensures that the Z-axis of the WGS84 datum coincides with the International Reference Pole, and that the prime meridian of the ellipsoid (that is, the plane containing the Z and X Cartesian axes) coincides with the International Reference Meridian.
  • The shape and size of the WGS84 biaxial ellipsoid is defined by the semi-major axis length a  6378137.0 metres, and the reciprocal of flattening 1/f  298.257223563. This ellipsoid is the same shape and size as the GRS80 ellipsoid.
  • Conventional values are also adopted for the standard angular velocity of the Earth, and for the Earth gravitational constant. The first is needed for time measurement, and the second to define the scale of the system in a relativistic sense.
Now then, if you find yourself getting lost on the way from Foyle's to the nearest Lyon's tea shop, you can't say you haven't been warned!


Wednesday, 24 August 2011

Interview with Directions Magazine

The Twittersphere is buzzing with my latest (well, only) interview with Directions Magazine on the State of the JTS Topology Suite.


Props to Rob Rutherford and Amber Weber at Clover Point for setting this up!

Thursday, 14 July 2011

Would you be lost without it?

Nowadays GPS is ubiquitous in electronic gadgets (no electric toothbrush is complete without it!) GPS is a classic example of iceberg technology 1. An output which in one sense verges on trivial - two numbers! - in fact relies on a huge unseen infrastructure of technology, physics, organizations, and yes, government funding.

The UK Telegraph has an interesting article on GPS 2 covering some of the technical, scientific, historic and political background to the system.


On a side note, I'm happy to observe that statements like this aren't as common as they used to be:

Slightly worryingly, when I was invited to watch a “contact” in another control room earlier in the day, the software crashed and a familiar, blue Microsoft Windows screen appeared on the wall


Notes:
  1. yes I made this up. My entry for Internet memedom!
  2. don't worry, it's still safe to use your cellphone after visiting this site